DT’s solutions for app developers reduces obstacles in finding high quality users your app needs to thrive. It's simplicity and high impact results, combined.
Whether you're ready to grow your user base, your revenue, or both, DT has you covered with the best technology and people behind it. Get ready to accelerate your mobile results with us.
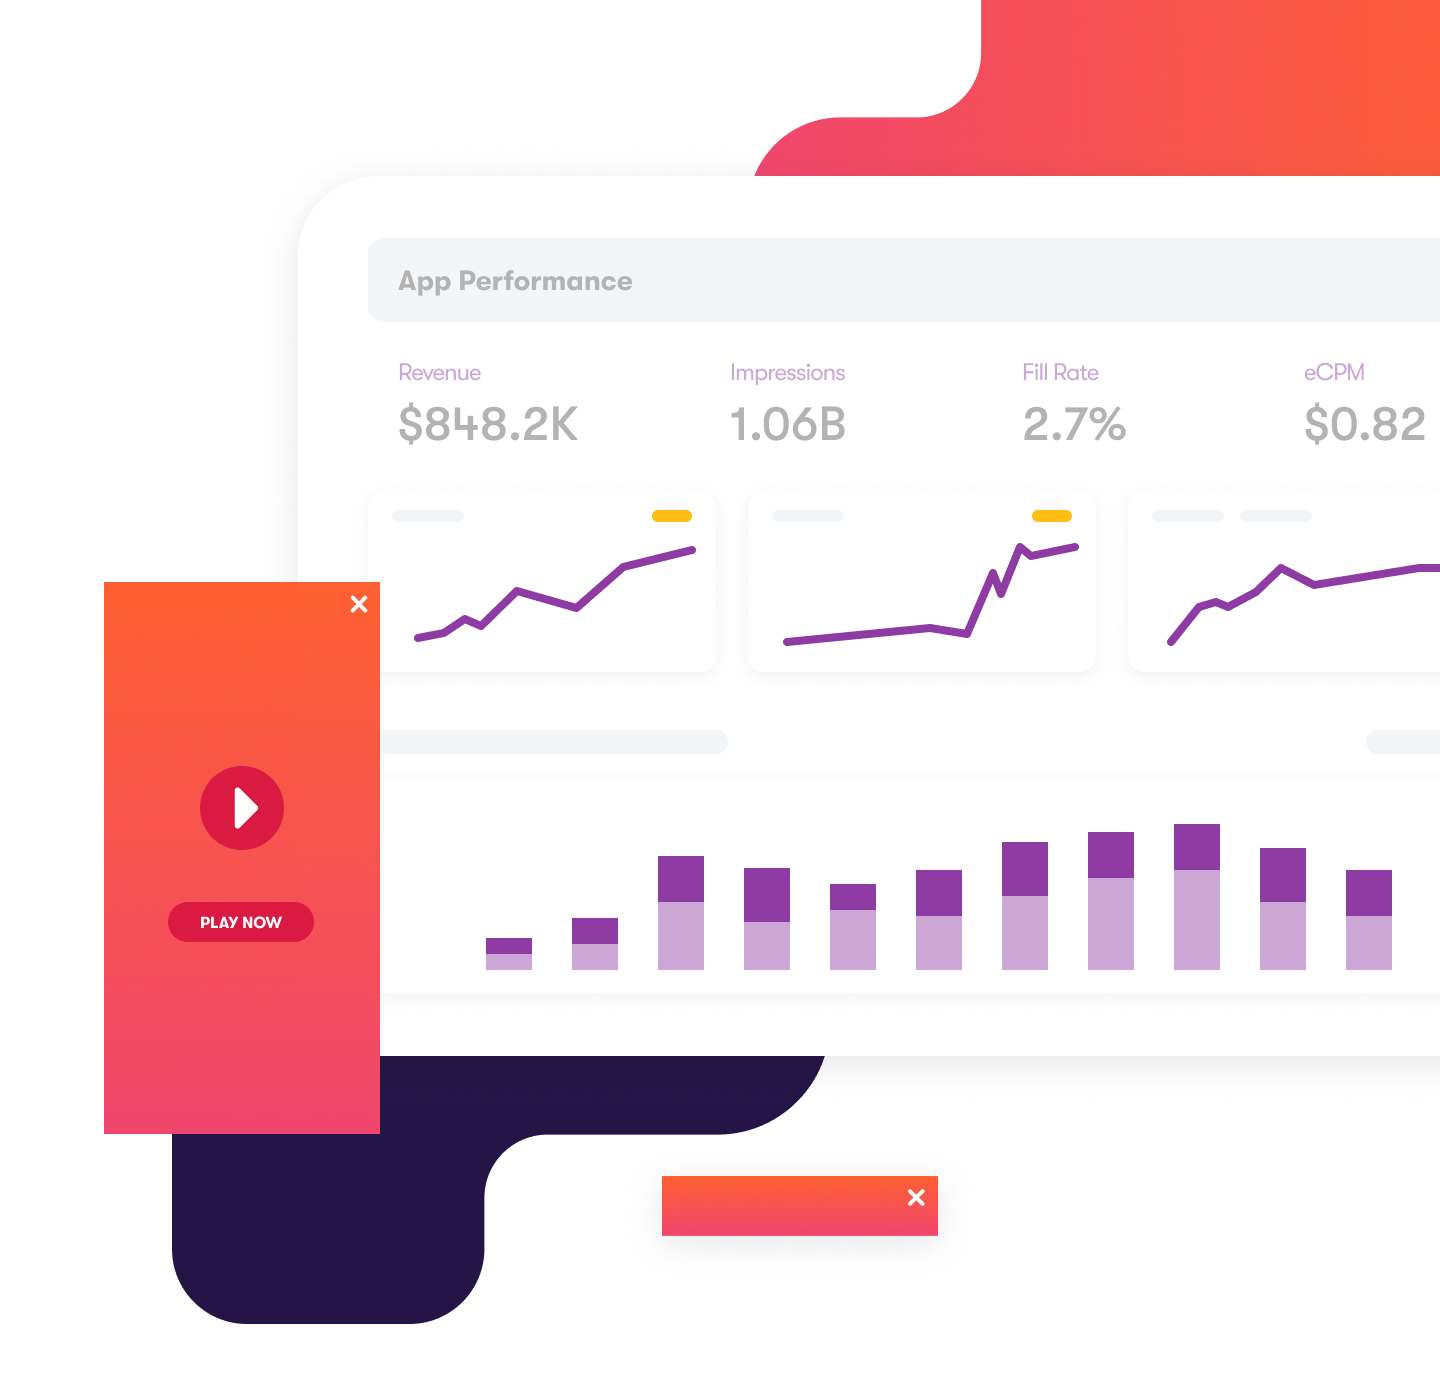
Grow revenue with high levels of transparency, execution, and diversity of demand.
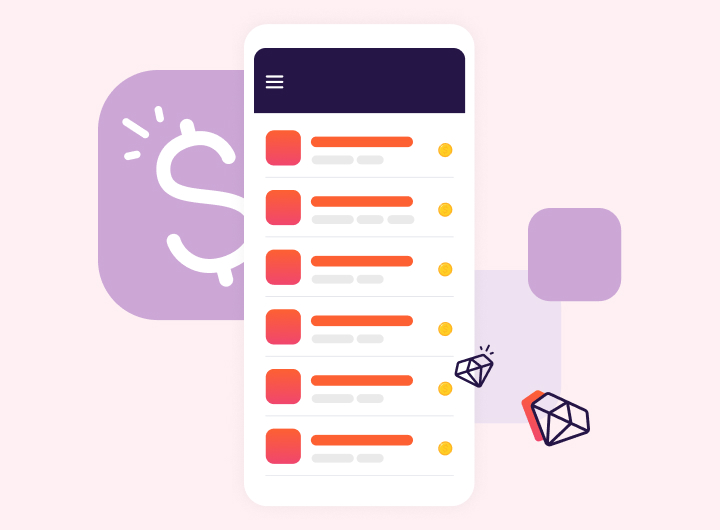
DT Exchange
Leading monetization platform hits the balance between high eCPMs and positive user experience across all ad formats, connecting your app to performance and brand demand.
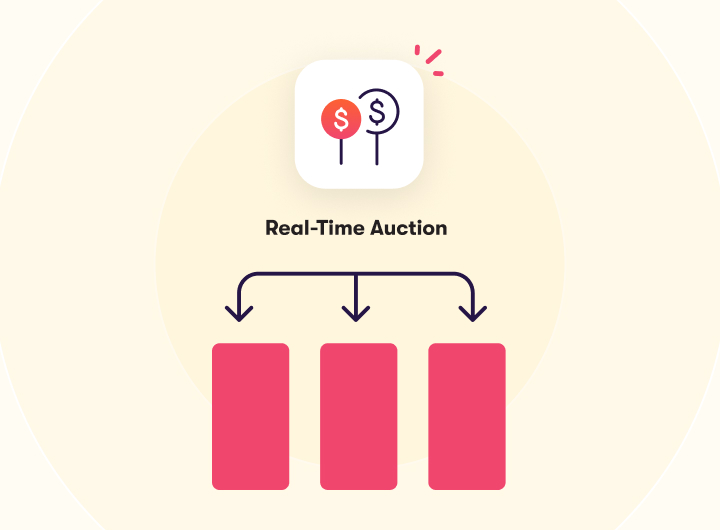
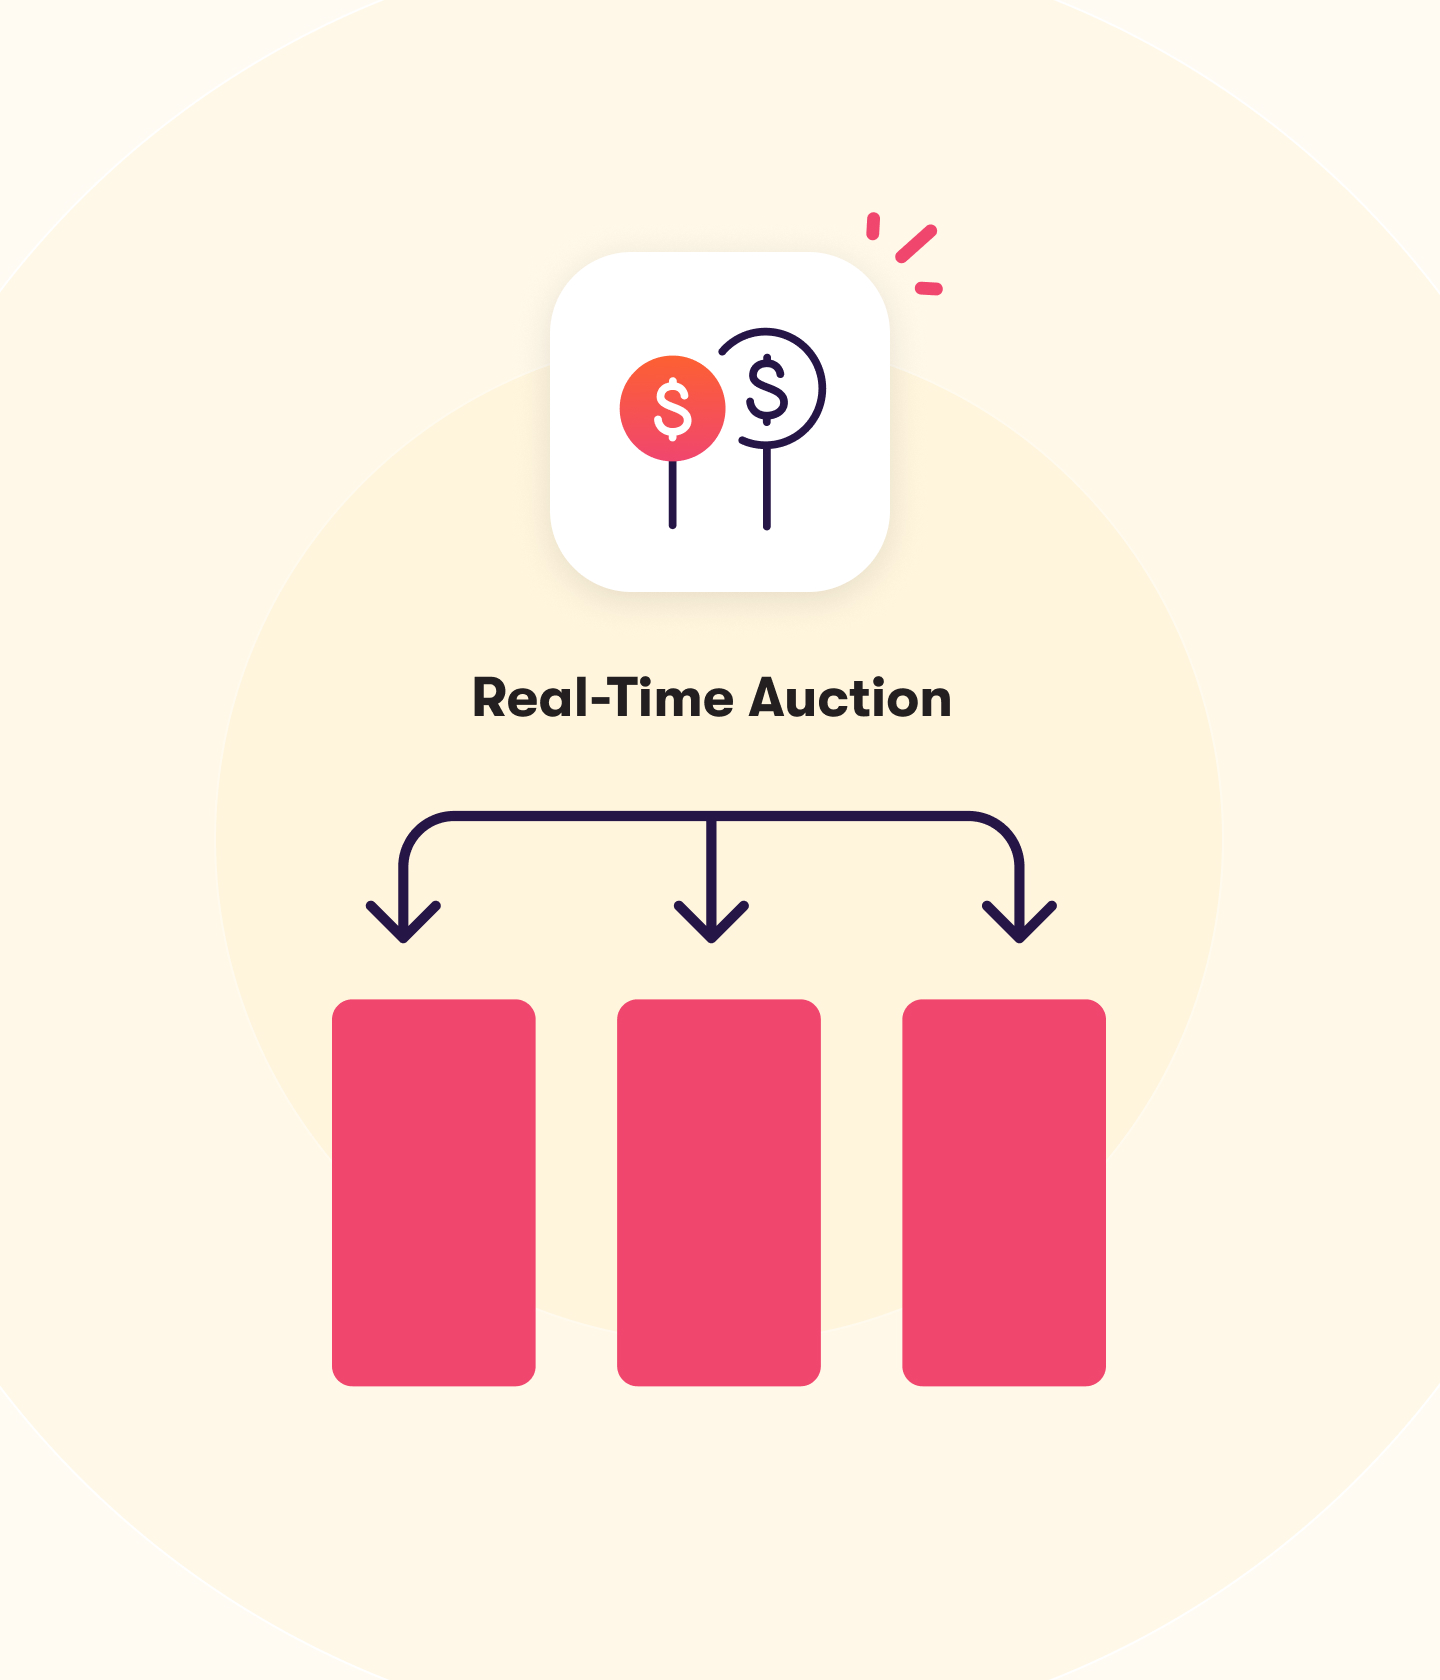
A transparent, revenue-optimized mediation. Simple auction mechanics with real-time, guaranteed bids from ad networks & DSPs. A unified auction where highest bid wins.
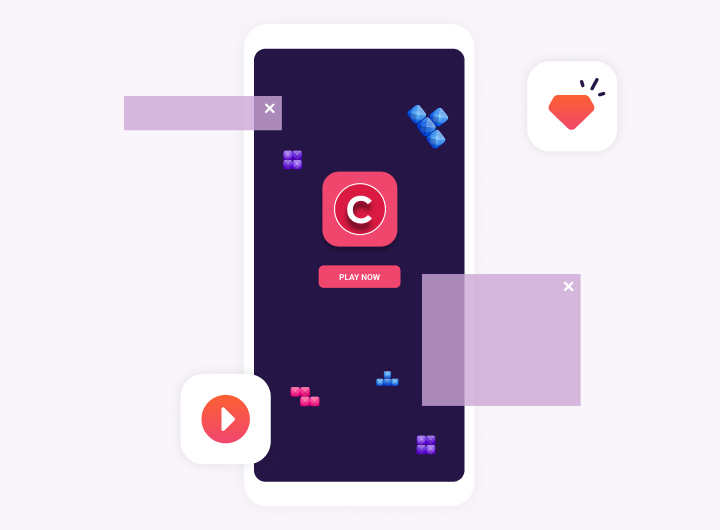
A non-intrusive rewarded ad format that allows you to monetize your entire user base, complementing your IAP revenue with seamless integration into your app economy.